Inserting and Modifying Objects
Inserting and Modifying Objects
A presentation is mainly a visual communication tool, therefore you should use objects like images, tables, drawings, charts and video to your presentations.
Inserting objects
You can insert objects in a slide with one of the following ways:
a) Inserting from a content layout slide.
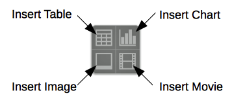
When using a predefined content layout slide you can quickly insert an Image, Table, Chart or Audio/Video file using the button in the autolayout box. Click one of the available options to insert an image, table, chart or movie.
b) Using the Insert Submenu
Alternatively you can use the Insert submenu item to insert any type of object.

c) Using the toolbar
You can also insert objects using one of the available buttons on the standard toolbar.
![]()
Modifying Objects
Modifying objects in Impress it's similar as in Writer. When you select an object, the corresponding functions are automatically activated in the Properties window on the sidebar. We can also format an object from the toolbar, the context menu, or the main menu.
Images
Images are often used in presentations as they can convey a large amount of information more quickly than text. When you select an image inside a slide the, Graphic formating group appears in the Sidebar where you can change image specific attributes.
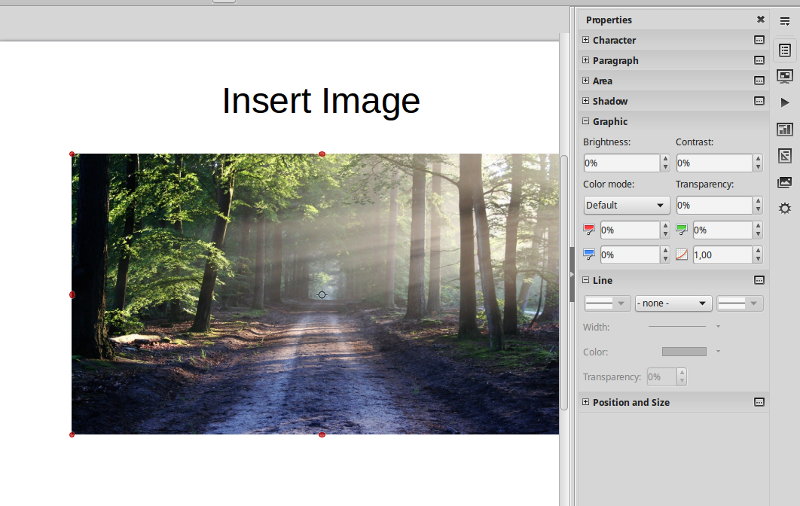
You can also use the Drawing toolbar to Rotate, Align, Crop, Arrange and other image formating commands. For more options you can enable the Image toolbar. (View > Toolbars > Image).
![]()
Resizing, Moving and Rotating
You can resize, move and rotate an image object as with any type of object. Select the image and drag to move, or move to handlers to resize or rotate.
Tables
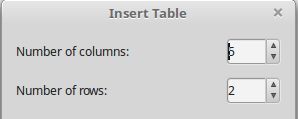
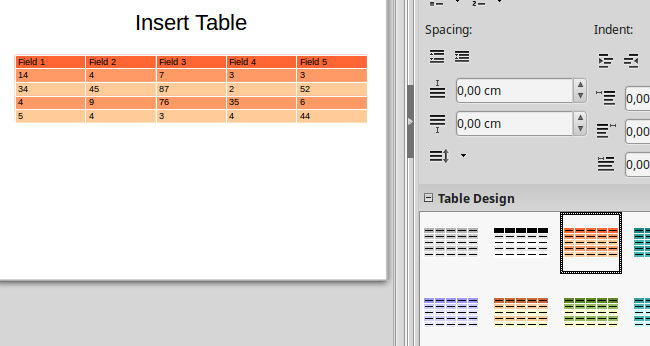
Tables are a powerful mechanism to display large amount of data in a structured and more readable form. When you insert a table in Impress you are asked to specify the number of columns and rows.
You can now enter data and format a table in the same way you have learned with LibreOffice Writer.

When you select a table the Table toolbar appears on the bottom of Impress main window.
![]()
To quickly change the design or style of a table click one of the predefined table styles in the Table Design in the Sidebar.
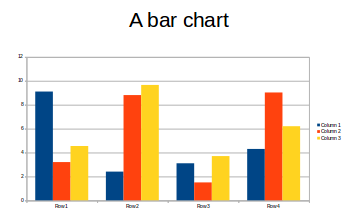
Charts
Another more graphical way to display data is using charts. In Impress you can insert diagrams and define the data to display. You will learn about charts later in this course in LibreOffice Calc lessons.
Drawings
To insert drawing objects (for example rectangles, arrows) use the Drawing Toolbar. This toolbar contains the majority of the tools normally used to create graphic objects.
![]()
To draw a shape, select the desired tool from the toolbar, then place your cursor on the slide and drag the mouse to define an enclosing rectangle.

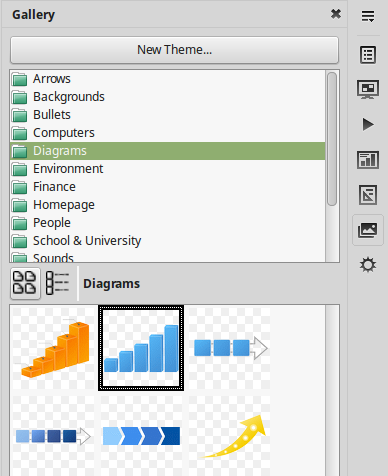
Objects from the Gallery
LibreOffice Gallery contains a collection of cliparts you can use in your slides. Browse the Gallery categories to find a clipart and drag it to your slide. The diagrams category contains shapes common diagrams for presentations.