Groups and Subtotals
Groups and Subtotals
You can create an outline of your data and group rows or columns together so that you can collapse a group to hide it or expand a group to show it using a single click. The Subtotal command in Calc automatically creates groups and applies common functions like SUM to the grouped data.
Grouping
Calc can organize data into groups, allowing you to easily show and hide different sections of your spreadsheet. To group a number of rows or columns:
1. Select the rows or columns you want to group in your spreadsheet.
2. Go to Data > Group and Outline > Group on the menu bar, or press the F12 key.

Hiding and showing details
Above the grouped columns a control appears to show (+) or hide (-) the group. However, if there are groups nested within each other, the basic controls have numbered buttons so you can hide the different levels of nested groups. To hide a group of rows or columns, click the minus sign (-). To display hidden groups of rows or columns, click the plus sign (+).

Ungrouping
To ungroup any groups of rows or columns:
- Make sure the grouped rows or columns are displayed.
- Select the grouped rows or columns
- Go to Data > Group and Outline > Ungroup on the menu bar, or use the keyboard combination Ctrl+F12.
Subtotals
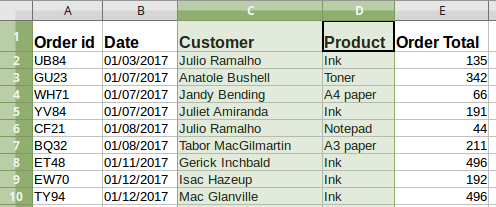
The Subtotal command allows you to automatically create groups and use common functions like SUM, COUNT, and AVERAGE to help summarize your data. For example, you could use the Subtotal command to calculate the cost of office supplies by type from a large inventory order. To insert subtotal values into a sheet:
1. Ensure that the columns have labels.
2. Select, or click in a single cell in the range of cells that you want to calculate subtotals for, and then choose Data > Subtotals.
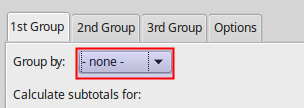
3. In the Subtotals dialog select
- In the Group by list, select the column by which the subtotals need to be grouped. A subtotal will be calculated for each distinct value in this column.
- In the Calculate subtotals for box, select the columns containing the values that you want to create subtotals for.
- In the Use function box, select the function that you want to use to calculate the subtotals.

4. When you click OK, the rows are grouped and the subtotals are calculated for the column you specified.

Additional levels of Grouping
You can create a additional levels of group by subtotals using the 2nd Group and 3rd Group tabs and repeating step 3. Here is an example where we added a second grouping by Product that counts the number of products.

Remove Subtotals
To remove Subtotals choose Data > Subtotals and select the None group in the Groups by drop-down list box.