Charts in Writer and Impress
Charts in Writer and Impress
Charts can be inserted to other components of LibreOffice such as Writer, Impress and Draw. When you create a chart in Calc you can export as image or copy and paste it to another application. In Writer and Impress you can also create a chart manually.
Insert a chart as Image
With this method you can place a chart to any application that insert images.
- In Calc export the the chart as png image
- In Writer or Impress use the
 Insert Image button to insert the chart graphic.
You can position and resize or edit other properties of the graphic object. You can not however change any of the chart properties.
As a Chart object
To be able to edit the chart properties you must insert the chart as an object.
- In Calc right click on a chart object and select Copy
- In Writer or Impress Paste the graph in the page or slide.
- Now if you double click on the chart you enter the chart edit mode and the Chart Toolbar appears.
Create a chart manually
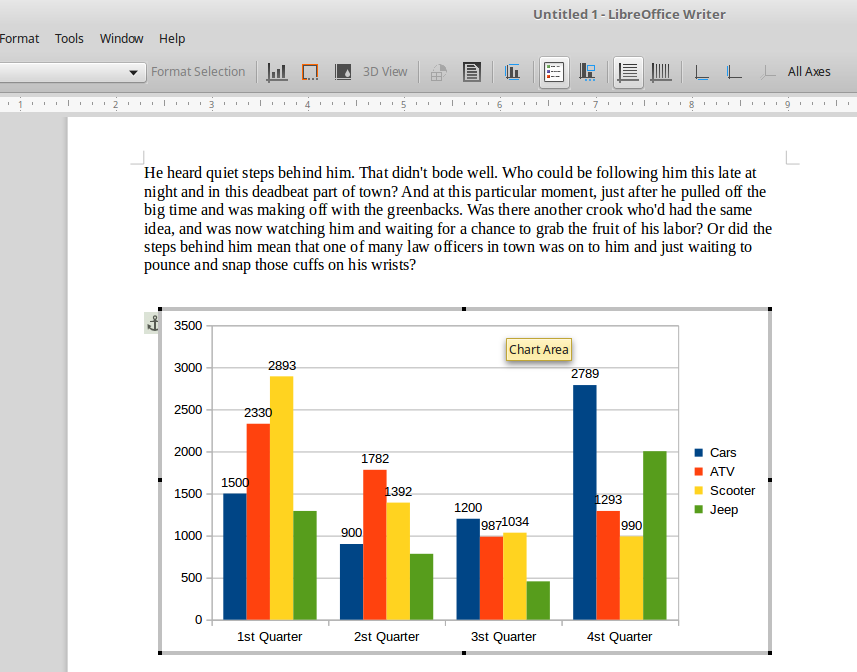
In Writer or Impress you can use the Insert Chart menu command or toolbar button ![]() to create a chart. In this case you must enter the chart data manually. When you click the Insert Chart button a default chart is created. Now double click on the chart to enter chart edit mode.
to create a chart. In this case you must enter the chart data manually. When you click the Insert Chart button a default chart is created. Now double click on the chart to enter chart edit mode.

Click now the ![]() Data Table button to enter the chart data. Then you can edit chart properties (type, titles, legend, area colors).
Data Table button to enter the chart data. Then you can edit chart properties (type, titles, legend, area colors).
