Glue points, connectors and flow charts
Glue points, connectors and flow charts
In Draw, you can connect two shapes with a line called a connector. When you draw a connector between shapes, the connector will be attached to a gluepoint on each shape. These functions are particularly useful in creating charts and diagrams because we can move the shapes without loosing the connections between them.
Glue points
All Draw objects have glue points, which are not normally displayed. Glue points become visible when the Connectors icon ![]() is selected on the Drawing toolbar. Most objects have four glue points. You can add more glue points and customize glue points, using the Glue Points toolbar. Go to View > Toolbars > Glue Points to open the toolbar.
is selected on the Drawing toolbar. Most objects have four glue points. You can add more glue points and customize glue points, using the Glue Points toolbar. Go to View > Toolbars > Glue Points to open the toolbar.
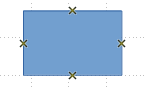
Glue points are not the same as the selection handles of an object. The handles are for moving or changing the shape of an object. Glue points are used to fix or glue a connector to an object so that when the object moves, the connector stays fixed to the object.
Connectors
Connectors are lines or arrows whose ends automatically snap to a glue point of an object. Connectors are especially useful in drawing organization charts, flow diagrams, and mind-maps. When objects are moved or reordered, the connectors remain attached to a glue point.
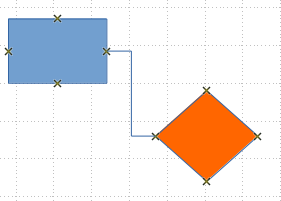
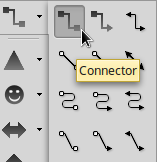
Draw offers a range of different connectors and connector functions. On the Drawing toolbar, click on the triangle next to the Connector icon to open the Connectors toolbar. Select the connection type and drag with the mouse to draw a line that connects two shapes.
Flowcharts
For drawing flowcharts, Draw has a dedicated toolbar that includes a large selection of tools to help you to easily draw a flowchart. Click on the small triangle to the right of the Flowchart icon on the Drawing toolbar to open the Flowchart pop up toolbar. Note that this icon changes shape depending on the last flowchart tool used.
![]()
An example of a flow chart is shown below.

Tips for flow charts
- Add text to each flowchart shape to make it easily identified in the flowchart.
- Use connections lines in your flowchart. This allows repositioning of an object in your chart while maintaining connections with the other objects in the chart.
- Use the zoom, grid and snap functions to help in positioning objects in your flowchart.
- Use the alignment and distribution functions to give your flowchart a more professional look.
- Duplicate objects when you require more than one of the same shape and size.
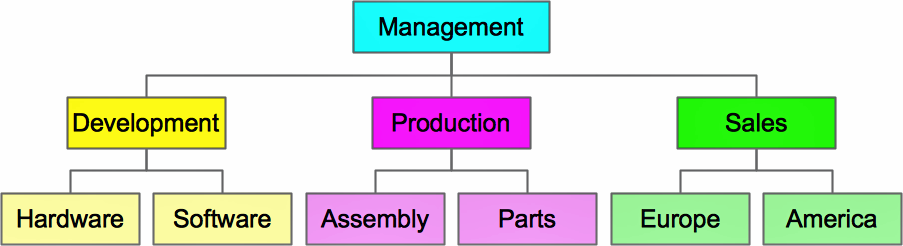
Organizational charts
Draw does not have a dedicated toolbar for organizational charts, but these charts are easily created using basic shapes, flowchart shapes, connection points and connector lines. Hierarchy in an organization is easily indicated using shading and/or color. An example of an organization chart is shown below.